
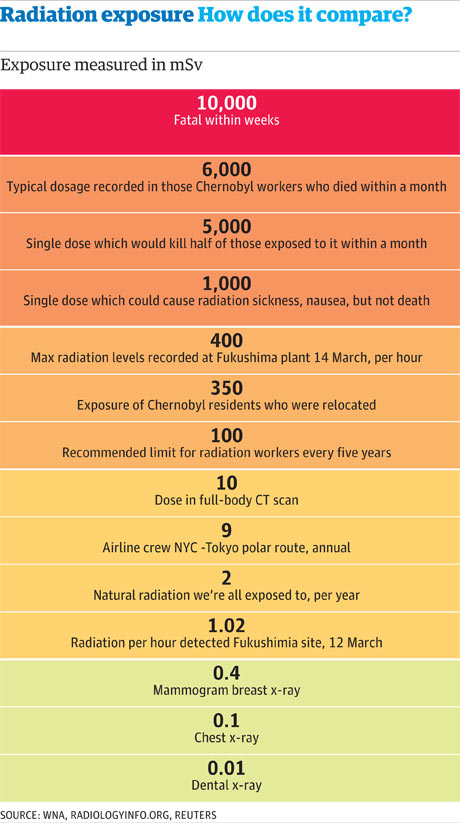
As radiation exposure around the Fukushima nuclear power plant reach levels of 400mSv per hour (although they've since gone down), we thought it was time to put the figures into perspective.
Radiation is all around us, all the time. But what level does it have to get to before it becomes really dangerous?
The World Nuclear Association (which represents the 'global nuclear profession') does have a guide. And while there is a touch of Smilin' Joe Fission, it is a good place to start for a useful primer.
There are different kinds of radiation - which you can read about in the WNA guide. The problems we're concerned about come from ionising radiation.
Radiation dosages are measured in sieverts - but because these are so big we're talking about millisieverts mSv (a thousandth of a sievert). Rather than being an exact unit of size (because different types of radiation have different effects) an mSv measures the effective radiation dose. According to the WNA, each mSv of radiation "produces the same biological effect".
We're exposed to radiation when we fly and when we get medical treatment - and whenever we leave the house. But the large dosages can have dramatic effects.
It has been known for many years that large doses of ionising radiation, very much larger than background levels, can cause a measurable increase in cancers and leukemias ('cancer of the blood') after some years delay. It must also be assumed, because of experiments on plants and animals, that ionising radiation can also cause genetic mutations that affect future generations, although there has been no evidence of radiation-induced mutation in humans. At very high levels, radiation can cause sickness and death within weeks of exposure
So, how high are levels in Japan? @mariansteinbach has been crowdsourcing the levels recorded at monitoring stations across Japan from the the official nuclear monitoring site here. Here are the results (in Grays, which are a unit of size, not of the effective dose received by people in the area). The users have also been monitoring a Geiger counter in Tokyo too (and here's how to read a Geiger counter).
So, how do the levels compare? We've accumulated information from the WNA, news agency reports and medical info site Radiologyinfo.org.
Data summary
Download the data
• DATA: download the full spreadsheet
More data
Data journalism and data visualisations from the Guardian
World government data
• Search the world's government data with our gateway
Development and aid data
• Search the world's global development data with our gateway
Can you do something with this data?
• Flickr Please post your visualisations and mash-ups on our Flickr group
• Contact us at data@guardian.co.uk
• Get the A-Z of data
• More at the Datastore directory
• Follow us on Twitter
• Like us on Facebook
