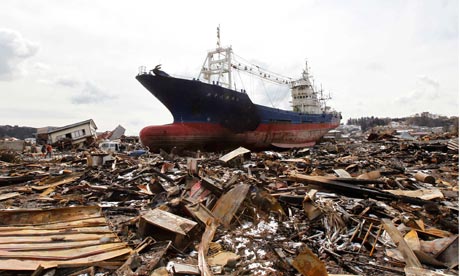
A ship brought in by the Japanese tsunami of 11 March 2011 Photograph: Kim Kyung-Hoon/REUTERS
The March 2011 tsunami has played a major role in knocking Japan of the top of global female life expectancy rankings for the first time in 26 years.
Life expectancy at birth for Japanese women fell by 0.4 years - almost five months - in 2011, according to figures provided by the country's health and labour ministry.
Japanese women had an average lifespan of 86.3 years in 2010, but the loss of life attributed to the disaster - particularly among the elderly - played a significant part in bringing life expectancy at birth down to 85.9.
Women in Hong Kong now have the longest life expectancy in the world, living an average of 86.7 years.
Justin McCurry, the Guardian's Tokyo correspondent, has more on the story here. He writes:
The large number of elderly victims was a defining characteristic of the disaster in March 2011, which killed almost 16,000 people and left about 3,000 unaccounted for. National police agency statistics show that more than 56% of those who died were aged 65 or older, and almost three-quarters of those missing were over 60.
Craig Bloodworth, from The Information Lab, has used data from the UN Demographic Yearbook 2009-10 and self-reported statistics from selected countries to visualise male and female life expectancy across the globe.
Filter the data by gender using the menu on the right, or find out how countries compare to a specific nation using the tool to the left.
Browse the raw figures below. What can you do with this data?
Data summary
Life expectancy at birth for selected countries
Click headings to sort. Download the data
|
Region
|
Country
|
Period
|
Male
|
Female
|
Population (10,000s)
|
|
|
| ASIA |
Japan |
2011* |
79.44 |
85.9 |
12,534 |
| AFRICA |
Algeria |
2008 |
74.9 |
76.6 |
3,598 |
| AFRICA |
Egypt |
2010 |
68.2 |
70.9 |
7,873 |
| AFRICA |
South Africa |
2009 |
53.5 |
57.2 |
4,999 |
| AFRICA |
Tunisia |
2010* |
72.7 |
76.6 |
1,055 |
| AFRICA |
Canada |
2007-2009* |
78.8 |
83.3 |
3,411 |
| AFRICA |
Costa Rica |
2010 |
76.8 |
81.8 |
456 |
| AFRICA |
Cuba |
2005-2007 |
76 |
80 |
1,124 |
| NORTH AMERICA |
Mexico |
2010* |
73.1 |
77.8 |
10,755 |
| NORTH AMERICA |
United States |
2010* |
76.2 |
81.1 |
30,905 |
| NORTH AMERICA |
Argentina |
2006-2010 |
72.5 |
80 |
4,052 |
| NORTH AMERICA |
Brazil |
2010* |
69.73 |
77.32 |
19,325 |
| SOUTH AMERICA |
Chile |
2010 |
75.8 |
81.2 |
1,709 |
| SOUTH AMERICA |
Colombia |
2005-2010 |
70.7 |
77.5 |
4,551 |
| SOUTH AMERICA |
Peru |
2000-2005 |
69 |
74.3 |
2,946 |
| SOUTH AMERICA |
Bangladesh |
2007 |
65.4 |
67.9 |
14,660 |
| SOUTH AMERICA |
China |
2000* |
69.63 |
73.33 |
133,474 |
| SOUTH AMERICA |
Cyprus |
2006-2007 |
78.3 |
81.9 |
80 |
| SOUTH AMERICA |
India |
2002-2006 |
62.6 |
64.2 |
118,211 |
| SOUTH AMERICA |
Iran |
2006 |
71.1 |
73.1 |
7,434 |
| ASIA |
Israel |
2010* |
79.7 |
83.4 |
763 |
| ASIA |
Malaysia |
2010* |
71.9 |
77 |
2,825 |
| ASIA |
Pakistan |
2007 |
63.6 |
67.6 |
16,515 |
| ASIA |
Qatar |
2008 |
77.9 |
78.1 |
171 |
| ASIA |
Republic of Korea |
2010* |
77.2 |
84.1 |
4,888 |
| ASIA |
Singapore |
2011* |
79.6 |
84.3 |
508 |
| ASIA |
Thailand |
2010* |
69.6 |
76.9 |
6,731 |
| ASIA |
Turkey |
2009 |
71.5 |
76.1 |
7,270 |
| ASIA |
Austria |
2011* |
78.11 |
83.45 |
839 |
| ASIA |
Belgium |
2009* |
77.3 |
82.8 |
1,088 |
| ASIA |
Czech Republic |
2011* |
74.69 |
80.74 |
1,052 |
| ASIA |
Denmark |
2010-2011* |
77.3 |
81.62 |
555 |
| ASIA |
Finland |
2011* |
77.2 |
83.5 |
534 |
| ASIA |
France |
2011* |
78.2 |
84.8 |
6,297 |
| ASIA |
Germany |
2008-2010* |
77.51 |
82.59 |
8,178 |
| ASIA |
Greece |
2009 |
77.7 |
82.8 |
1,128 |
| ASIA |
Iceland |
2011* |
79.9 |
83.6 |
32 |
| EUROPE |
Italy |
2011* |
79.4 |
84.5 |
6,048 |
| EUROPE |
Netherlands |
2011* |
79 |
82.7 |
1,662 |
| EUROPE |
Norway |
2011* |
79 |
83.45 |
489 |
| EUROPE |
Poland |
2011* |
72.4 |
80.9 |
3,818 |
| EUROPE |
Russian Federation |
2009 |
62.8 |
74.7 |
14,294 |
| EUROPE |
Spain |
2010* |
78.94 |
84.91 |
4,607 |
| EUROPE |
Sweden |
2011* |
79.81 |
83.7 |
938 |
| EUROPE |
Switzerland |
2010* |
80.2 |
84.6 |
783 |
| EUROPE |
Ukraine |
2007-2008 |
62.5 |
74.3 |
4,596 |
| EUROPE |
United Kingdom |
2008-2010* |
78.2 |
82.27 |
6,222 |
| OCEANIA |
Australia |
2008-2010* |
79.5 |
84 |
2,234 |
| OCEANIA |
New Zealand |
2008-2010* |
78.8 |
82.7 |
437 |
• DATA: download the full spreadsheet
NEW! Buy our book
• Facts are Sacred: the power of data (on Kindle)
More open data
Data journalism and data visualisations from the Guardian
World government data
• Search the world's government data with our gateway
Development and aid data
• Search the world's global development data with our gateway
Can you do something with this data?
• Flickr Please post your visualisations and mash-ups on our Flickr group
• Contact us at data@guardian.co.uk
• Get the A-Z of data
• More at the Datastore directory
• Follow us on Twitter
• Like us on Facebook

