
Australia was once considered one of the world's most generous aid donors. More recently, Canberra has been criticised for pushing back plans to increase aid spending and for diverting money from overseas development projects to help pay for controversial asylum-seeker schemes at home and in Papua New Guinea (PNG).
Oxfam has accused the government of treating the aid budget like an ATM machine and Samah Hadid, from the Global Poverty Project, has lamented that, as Australians prepare to vote in September's federal election, the country's major parties have shown "the weakest global poverty commitments in years".
So how much does Australia spend on foreign aid? Where does the money go? And how has the pattern of spending changed?
The big picture
Australia reported spending $5.4bn (£3.2m) on official development assistance (ODA) in 2012. This makes it the eighth largest aid donor in the Organisation for Economic Co-operation and Development (OECD) group of rich countries, just ahead of Sweden ($5.2bn) and behind Canada ($5.6bn), and the Netherlands ($5.5bn).
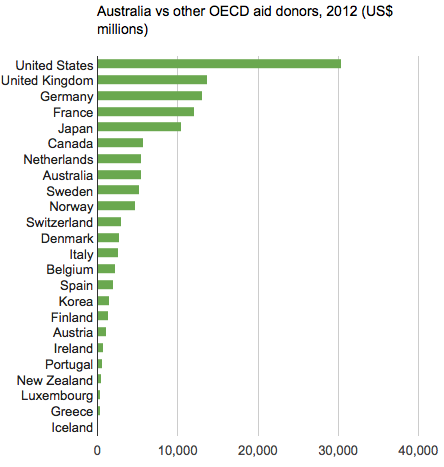 Source: OECD
Beyond absolute figures, however, ODA spending as a percentage of gross national income (GNI) is often used as a measure of an aid donor's generosity.
In 2012, Australia spent 0.36% of its GNI on aid, less than 12 other OECD donors including Luxembourg (1%), the UK (0.56%), and Switzerland (0.45%).
The long view
It has not always been like this. In the 1960s and 70s, Australia was seen as one of the world's most generous donors, spending up to 0.65% of its GNI on aid.
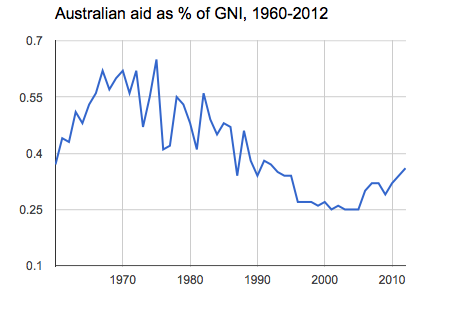 Source: OECD
In recent years, Australia has repeatedly promised to increase its aid spending to 0.5% of GNI, though the deadline for doing so has been pushed back on several occasions. In August, the government announced new plans to meet the 0.5% target in 2017-18, with much of the required spending increase delayed until that year.
A focus on Asia and the Pacific
The bulk of Australia's aid is focused on Asia and the Pacific. PNG and Indonesia are the top recipients, each receiving close to $500m in 2011.
Australia is PNG's largest aid donor, contributing almost 70% of total ODA to the country. This percentage could rise, however. Last month, the government said it would give PNG an extra A$420m in aid over four years as part of a controversial deal that would send people seeking asylum in Australia to its struggling Pacific neighbour instead.
Canberra says Indonesia and PNG will remain its largest aid recipients by a significant margin for the foreseeable future. In recent years, however, more Australian aid has gone to projects in Africa and Latin America.
Critics point out that, when the government decided in late 2012 to spend A$375m in aid money on people seeking asylum in Australia, the country in effect became the third largest recipient of its own foreign aid.
Health or education?
Australia's aid programme is guided by five overarching strategic goals and more than a dozen indicators. Projects focused on education (A$834m) and improving healthcare (A$646m) were among the best funded in 2011-2012, according to data published by AusAid, the government agency that handles the bulk of Australian aid.
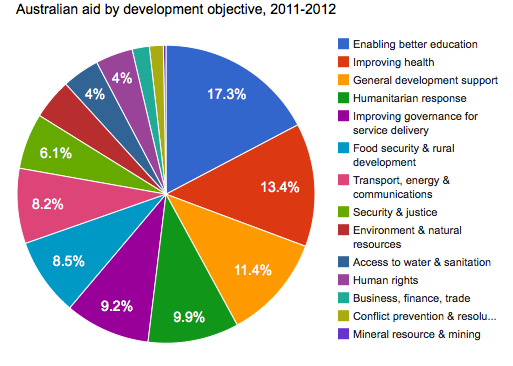
Projects focusing on mineral resources and mining benefited from the largest increase, with money spent jumping from A$341,000 in 2009-10 to A$14m in 2011-12. Spending on food security and rural development has also increased, to A$408m in 2011-12 compared with A$276m in 2009-10.
Companies or NGOs?
In 2011-12, less than 10% of Australian aid went directly to developing country governments, according to data published by AusAid.
Who gets the rest? You may expect it to go through NGOs. However, even though the proportion of Australian aid channelled through private companies has decreased in recent years, it still surpasses that given to NGOs.
In 2011-12, more than 40% of Australian ODA went through multilateral organisations such as the UN. Roughly 17% went via commercial suppliers, followed by almost 14% through NGOs.
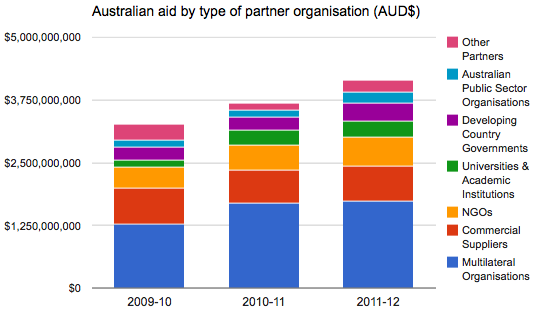 Note: Figures are in Australian dollars, current prices
The proportion delivered through private contractors has dropped from 41% to 23% over the past five years because, the government said in 2012, "the use of private contractors to deliver aid can mean that development gains are more difficult to maintain after Australian funding has finished".
Download the data
• Australian aid 1960 - 2012 (data from the OECD DAC)
• Australian aid by strategic goal and type of partner (data from AusAid)
More data
• More data journalism and data visualisations from the Guardian
Development and aid data
• More global development data
Can you do something with this data?
• Please post your visualisations and mash-ups on our Flickr group
• Contact us at development@theguardian.com